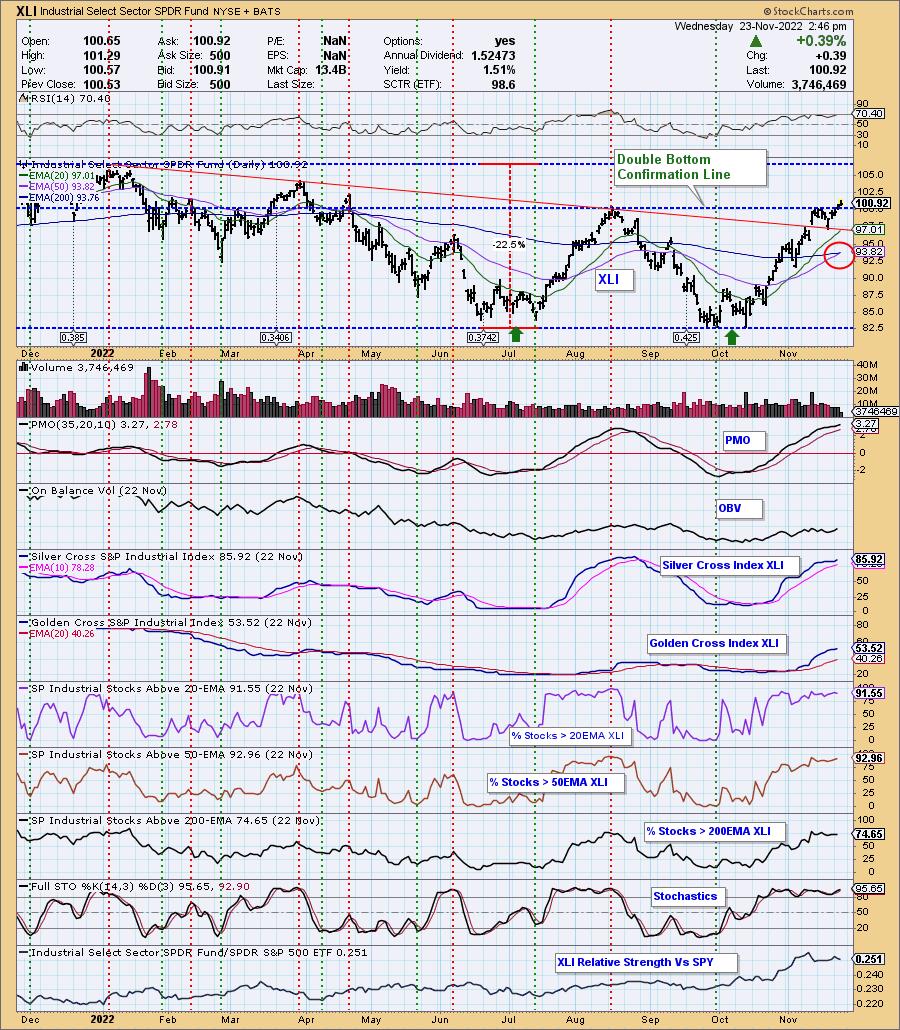
Today the Industrial Select Sector SPDR (XLI) 50-day exponential moving average (EMA) crossed up through the 200-day EMA (Golden Cross), generating an LT Trend Model BUY signal. While this is an encouraging event, we note that most indicators on the chart below are overbought — specifically, the PMO, Silver Cross Index*, and Percent Stocks Above 20/50/200EMAs. In a bull market, overbought conditions do not necessarily imply a rally’s end, but in a bear market, it is most likely that we will see a price top soon. That said, we have marked a double bottom, roughly July and October, with the confirmation line drawn across the August top. Price has eased above that line, implying a continued bullish outcome.
I always like to check the weekly chart to get a longer-term perspective, and I must say that this makes me more bullish about the situation. We can see a bearish rounded top terminated by the bullish double bottom, and the declining tops line has been decisively penetrated to the upside. Especially positive, the weekly PMO is rising from a double bottom that has formed a positive divergence. (The second PMO bottom is higher than the first, while the corresponding price bottom is lower.)
Positive and Negative Signs
The Industrials Sector (XLI) is showing positive signs and negative signs, but this is not particularly unusual in technical analysis. The weekly chart is strongly positive, in my opinion. The daily chart is mixed, the negative signs being overbought internals. If we are transitioning into a new bull market, the overbought condition won’t matter. If the bear market resumes, none of the positive signs will matter. I personally believe that we’re in a bear market rally, so caution is advised.
* The Silver Cross Index is the percentage of index component stocks with the 20EMA above the 50EMA.
Watch the latest episode of DecisionPoint on StockCharts TV’s YouTube channel here!
Technical Analysis is a windsock, not a crystal ball. –Carl Swenlin
(c) Copyright 2022 DecisionPoint.com
Helpful DecisionPoint Links:
DecisionPoint Alert Chart List
DecisionPoint Golden Cross/Silver Cross Index Chart List
DecisionPoint Sector Chart List
DecisionPoint Chart Gallery
Trend Models
Price Momentum Oscillator (PMO)
On Balance Volume
Swenlin Trading Oscillators (STO-B and STO-V)
ITBM and ITVM
SCTR Ranking
Bear Market Rules
DecisionPoint is not a registered investment advisor. Investment and trading decisions are solely your responsibility. DecisionPoint newsletters, blogs or website materials should NOT be interpreted as a recommendation or solicitation to buy or sell any security or to take any specific action.
